
Business financial model file
Meal Prep Service Financial Model
Budget meal-prep production and delivery before translating subscriber growth into cash from paid meals.

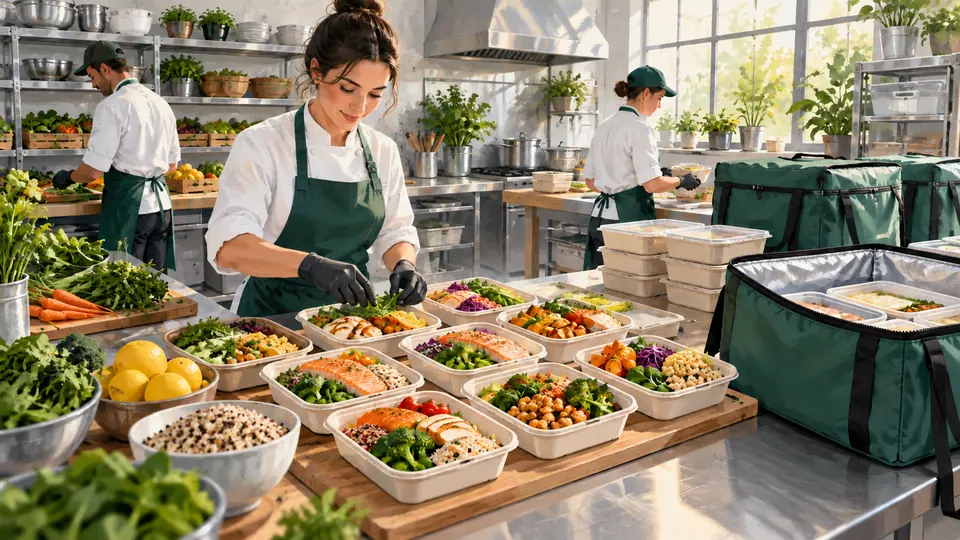
Opening investment and working cash
This original four-week plan prepares 20 batches of 100 portions. Preparation, chilling and sealing equipment are separate investments; opening stock and a rental deposit are working cash. It is not a national meal-prep startup quote or evidence that an existing kitchen has the required capacity.
| Cash use | $ |
|---|---|
| CAPEX: Preparation equipment | 18,000 |
| CAPEX: Chilling and freezer equipment | 16,000 |
| CAPEX: Sealing and labeling equipment | 12,000 |
| CAPEX: Racks and smallwares | 6,000 |
| Pre-opening: Recipe/allergen plans and permits | 5,000 |
| Pre-opening: Trial production and pre-opening payroll | 4,000 |
| Pre-opening: Launch promotion | 2,000 |
| Refundable deposit / tied-up cash | 4,800 |
| Opening stock / initial working inputs | 4,000 |
| Reserve: 2 selected fixed-cost months | 31,388 |
| Selected opening cash total | 103,188 |
CAPEX totals $52,000, pre-opening expense $11,000 and working cash $40,188. The deposit and opening stock tie up cash; they are not added again as monthly rent or consumed inputs. The reserve is a chosen fixed-cost buffer, not proof of full funding. Obtain actual installed/tax-inclusive quotes and dated opening payments.
Monthly fixed and variable OPEX
Loaded staff budgets use 160 cook hours at $25,160 prep hours at $20 and 80 coordination hours at $24, each with an original 20% employer allowance. Packaging and incremental delivery follow paid meals, while ingredients/variable energy apply to every prepared portion.
| Commitment | $ per month |
|---|---|
| Head cook: loaded 160-hour roster | 4,800 |
| Prep role: loaded 160-hour roster | 3,840 |
| Coordination: loaded 80-hour roster | 2,304 |
| Commissary rental | 2,400 |
| Base utilities | 400 |
| Insurance | 350 |
| Software | 200 |
| Cleaning/pest/waste | 400 |
| Marketing | 450 |
| Accounting/admin | 250 |
| Delivery fixed services | 300 |
| Total selected fixed cash | 15,694 |
| Cost driver | Basis | Monthly $ |
|---|---|---|
| Ingredients per prepared portion | 2,000 starts × $3.4 | 6,800 |
| Variable cooking energy per portion | 2,000 starts × $0.2 | 400 |
| Packaging per delivered meal | 1,800 paid units × $0.65 | 1,170 |
| Incremental delivery allocation per meal | 1,800 paid units × $0.8 | 1,440 |
| Percentage processing assumption | 3% × $26,100 | 783 |
| Total selected variable cash | Scheduled production plus sold-unit costs | 10,593 |
For the unchanged production schedule, $7,200 is spent on all starts, even if fewer units sell. Each extra paid unit from that schedule brings an unrounded $12.615 after the listed sold-unit costs and percentage fee. Do not spread a constant waste assumption over sales and then use that average contribution unchanged for a lower sell-through case.
Capacity, break-even and a lower-sales case
The two production roles provide 320 paid hours;75% productive time is 240 person-hours, permitting 2,000 prepared portions at 0.12 hours each. At 98% good yield only 1,960 meals can be sold, before confirming chill/dispatch timing. Assume $14.50 net per paid delivered meal; 1,800 planned paid deliveries produce $26,100 of revenue. Preparation loss and unsold good meals both need cash funding.
For this fixed mix and commitment, whole-unit cash break-even is 1,815 paid delivered meals per month: ($15,694 + $7,200 scheduled production cash) ÷ $12.615, rounded up. The aggregate capacity is 1,960 units; it does not establish customer demand or a workable daily sequence.
| Paid units | Net sales $ | Selected result $ |
|---|---|---|
| 1,600 | 23,200 | -2,710 |
| 1,815 | 26,317.50 | 2.23 |
| 1,800 (planned) | 26,100 | -187 |
| 1,960 | 28,420 | 1,831.40 |
The schedule's ingredient/energy spend remains when 1,600 meals are paid. If subscriptions pause, change the purchasing/production schedule in time rather than applying a per-delivered recipe cost to portions already made. The retained weekly menu case below has a separate volume and scope.
Practical KPI definitions
Reconcile prepared portions to good meals, paid deliveries and skips/refunds. Distinguish subscriber count from meals per subscriber and from delivery drops. Measure delivered contribution after last-mile cost, and weigh menu/changeover labor before adding another plan tier.
The month assumes collection and supplier/driver settlement within the period and no opening-stock change. Refund liability, financing, income tax and replacement equipment require their own cash dates.
Method context: SBA business planning. All case prices, wages, cost ratios, reserve and capacity inputs above are original planning assumptions.
What the selected model covers
The official Meal Prep Delivery Financial Model listing describes marketing spend and acquisition cost, trial conversion, subscriber tier mix, prices and transaction assumptions. Active subscribers roll forward monthly after churn; tier recurring revenue and optional transaction revenue feed profit and loss, monthly and annual cash forecasts and dashboard outputs.
Use delivered contribution to choose the offer
Our original broad-menu case improves the weekly result from $240 to $380 at 90 paid orders. With the same 100 prepared bundles, it needs 88 paid deliveries to beat the old menu; 87 leaves only $224.
Use measured renewals, skips, waste and changeover time to select the menu. Keep prepared bundles and paid deliveries reconciled beside the subscriber forecast. The Meal Prep Service planning guide develops the original worked case.
Planning guide